ISOlyze
Built for developers, testers, and certification partners, ISOlyze automatically interprets raw ISOBUS communication data and visualizes it in an intuitive way. Your team gains a transparent view of system relationships, accelerates error detection, and streamlines validation.

Smart Log Analysis for ISOBUS
ISOlyze transforms complex ISOBUS communication into clear insights. Structured views, message flows, and diagnostics replace endless hex values, giving your team transparency into system behavior. From Virtual Terminals to ECUs and Task Controllers, ISOlyze helps detect errors faster, streamline validations, and secure certification with confidence.

Key-Benefits of ISOlyze
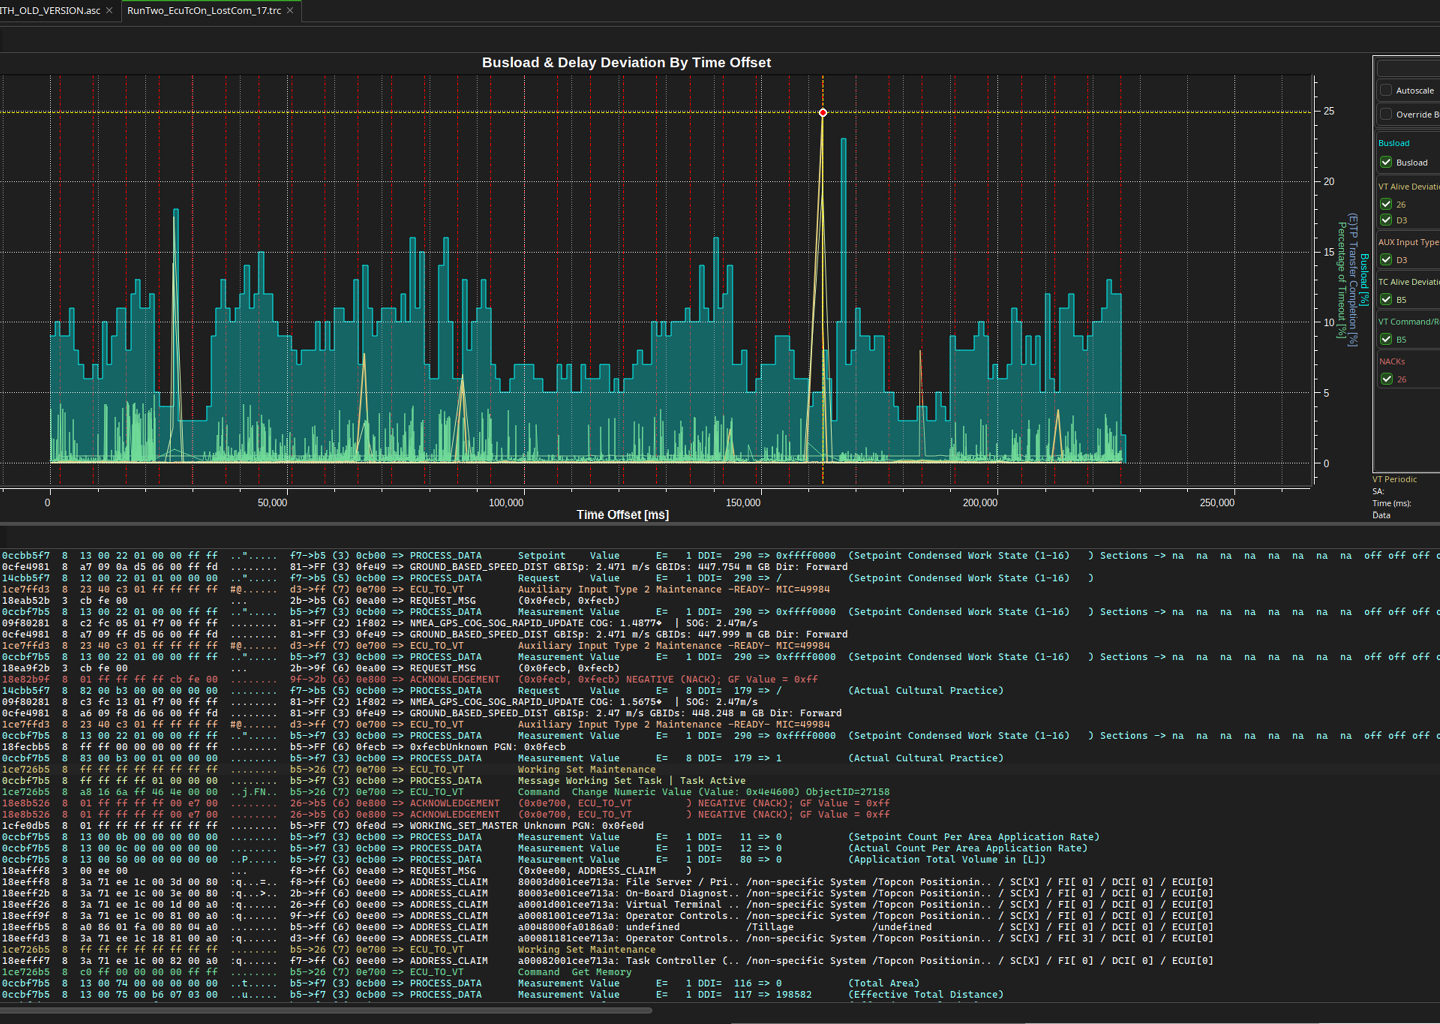
Clearer Insights with Visual Analysis
Color-coded syntax highlighting and interactive graphs turn complex ISOBUS logs into a readable visual story. Patterns, anomalies, and critical errors become instantly visible, helping your engineers focus on what really matters.

Clarity through Log Interpretation
Raw ISOBUS data is automatically converted into a human-readable format. This ensures your developers quickly identify communication structures, message delays, or conflicts without wasting time on manual decoding.
Maximum Compatibility
ISOlyze supports 29 ISOBUS log formats, giving your team a single tool to analyze data from tractors, implements, and controllers across different manufacturers. Unified workflows ensure consistent results without switching between applications.
Intuitive User Interface
The modern, adaptable interface makes even large datasets manageable. With flexible views, filters, and toggles, your team can focus on the most relevant details and reach insights more efficiently.
Multi-Log Analysis
ISOlyze lets your team open and compare multiple logs in parallel. This makes it easier to recognize recurring patterns, trace differences, and build a clear picture of overall machine behavior.
Functions of ISOlyze
Central Analysis Dashboard
A unified dashboard combines tabular and graphical views of ISOBUS communication. Your team gets a structured overview of key metrics, message flows, and contextual details for faster and clearer analysis.